How Much Debt Is Too Much? A Cash-Flow Check You Can Do Today
How much debt is too much depends on payments, income, and what remains for essentials. Use a debt-to-income ratio and cash-flow check to spot strain.
By Debt Payoff Planner by Cosmo Suite · Editorial policy
Published · 7 min read
General information, not financial advice.
If you keep making the payments but have little left for the rest of the month, it can be hard to tell whether the problem is your debt balance, your monthly payments, or the timing of your income. A lender's ratio may help answer one part. Your own cash flow answers another.
There is no single debt amount that is too much for everyone. Check the share of gross income going to required debt payments, then look at what remains from take-home pay after essentials. If you miss payments or use new debt for basics, your month is under pressure, whatever the ratio says.
Key Takeaways: Your check
- Payment share: required monthly debt payments ÷ gross monthly income.
- Room left: take-home pay minus essentials and required debt payments.
- Next date: mark the next due date you may struggle to cover, then contact that lender before it passes.
What the ratio can tell you
Debt-to-income ratio (DTI) is monthly debt payments divided by gross monthly income. It describes the payment load. It cannot decide whether your household can handle it.
Gross monthly income is your pay before taxes and other deductions. Take-home pay is the amount deposited after those deductions. Use gross income for DTI and take-home pay for your cash-flow check.
| Check | Calculation | What it answers |
|---|---|---|
| Debt-to-income ratio | Monthly debt payments ÷ gross monthly income | How much pre-tax income goes to debt payments? |
| Cash-flow room | Take-home pay − essentials − required debt payments | What remains after this month's basics and minimums? |
| Balance total | Add the outstanding balances | How much principal is still owed? |
The CFPB says lenders use DTI to assess a borrower's ability to manage payments. Limits vary by lender and loan product. Its example uses $2,000 in monthly debt payments and $6,000 gross income, which equals 33%. Treat that as a calculation example, not a safe limit for everyone. (CFPB, reviewed August 28, 2023)
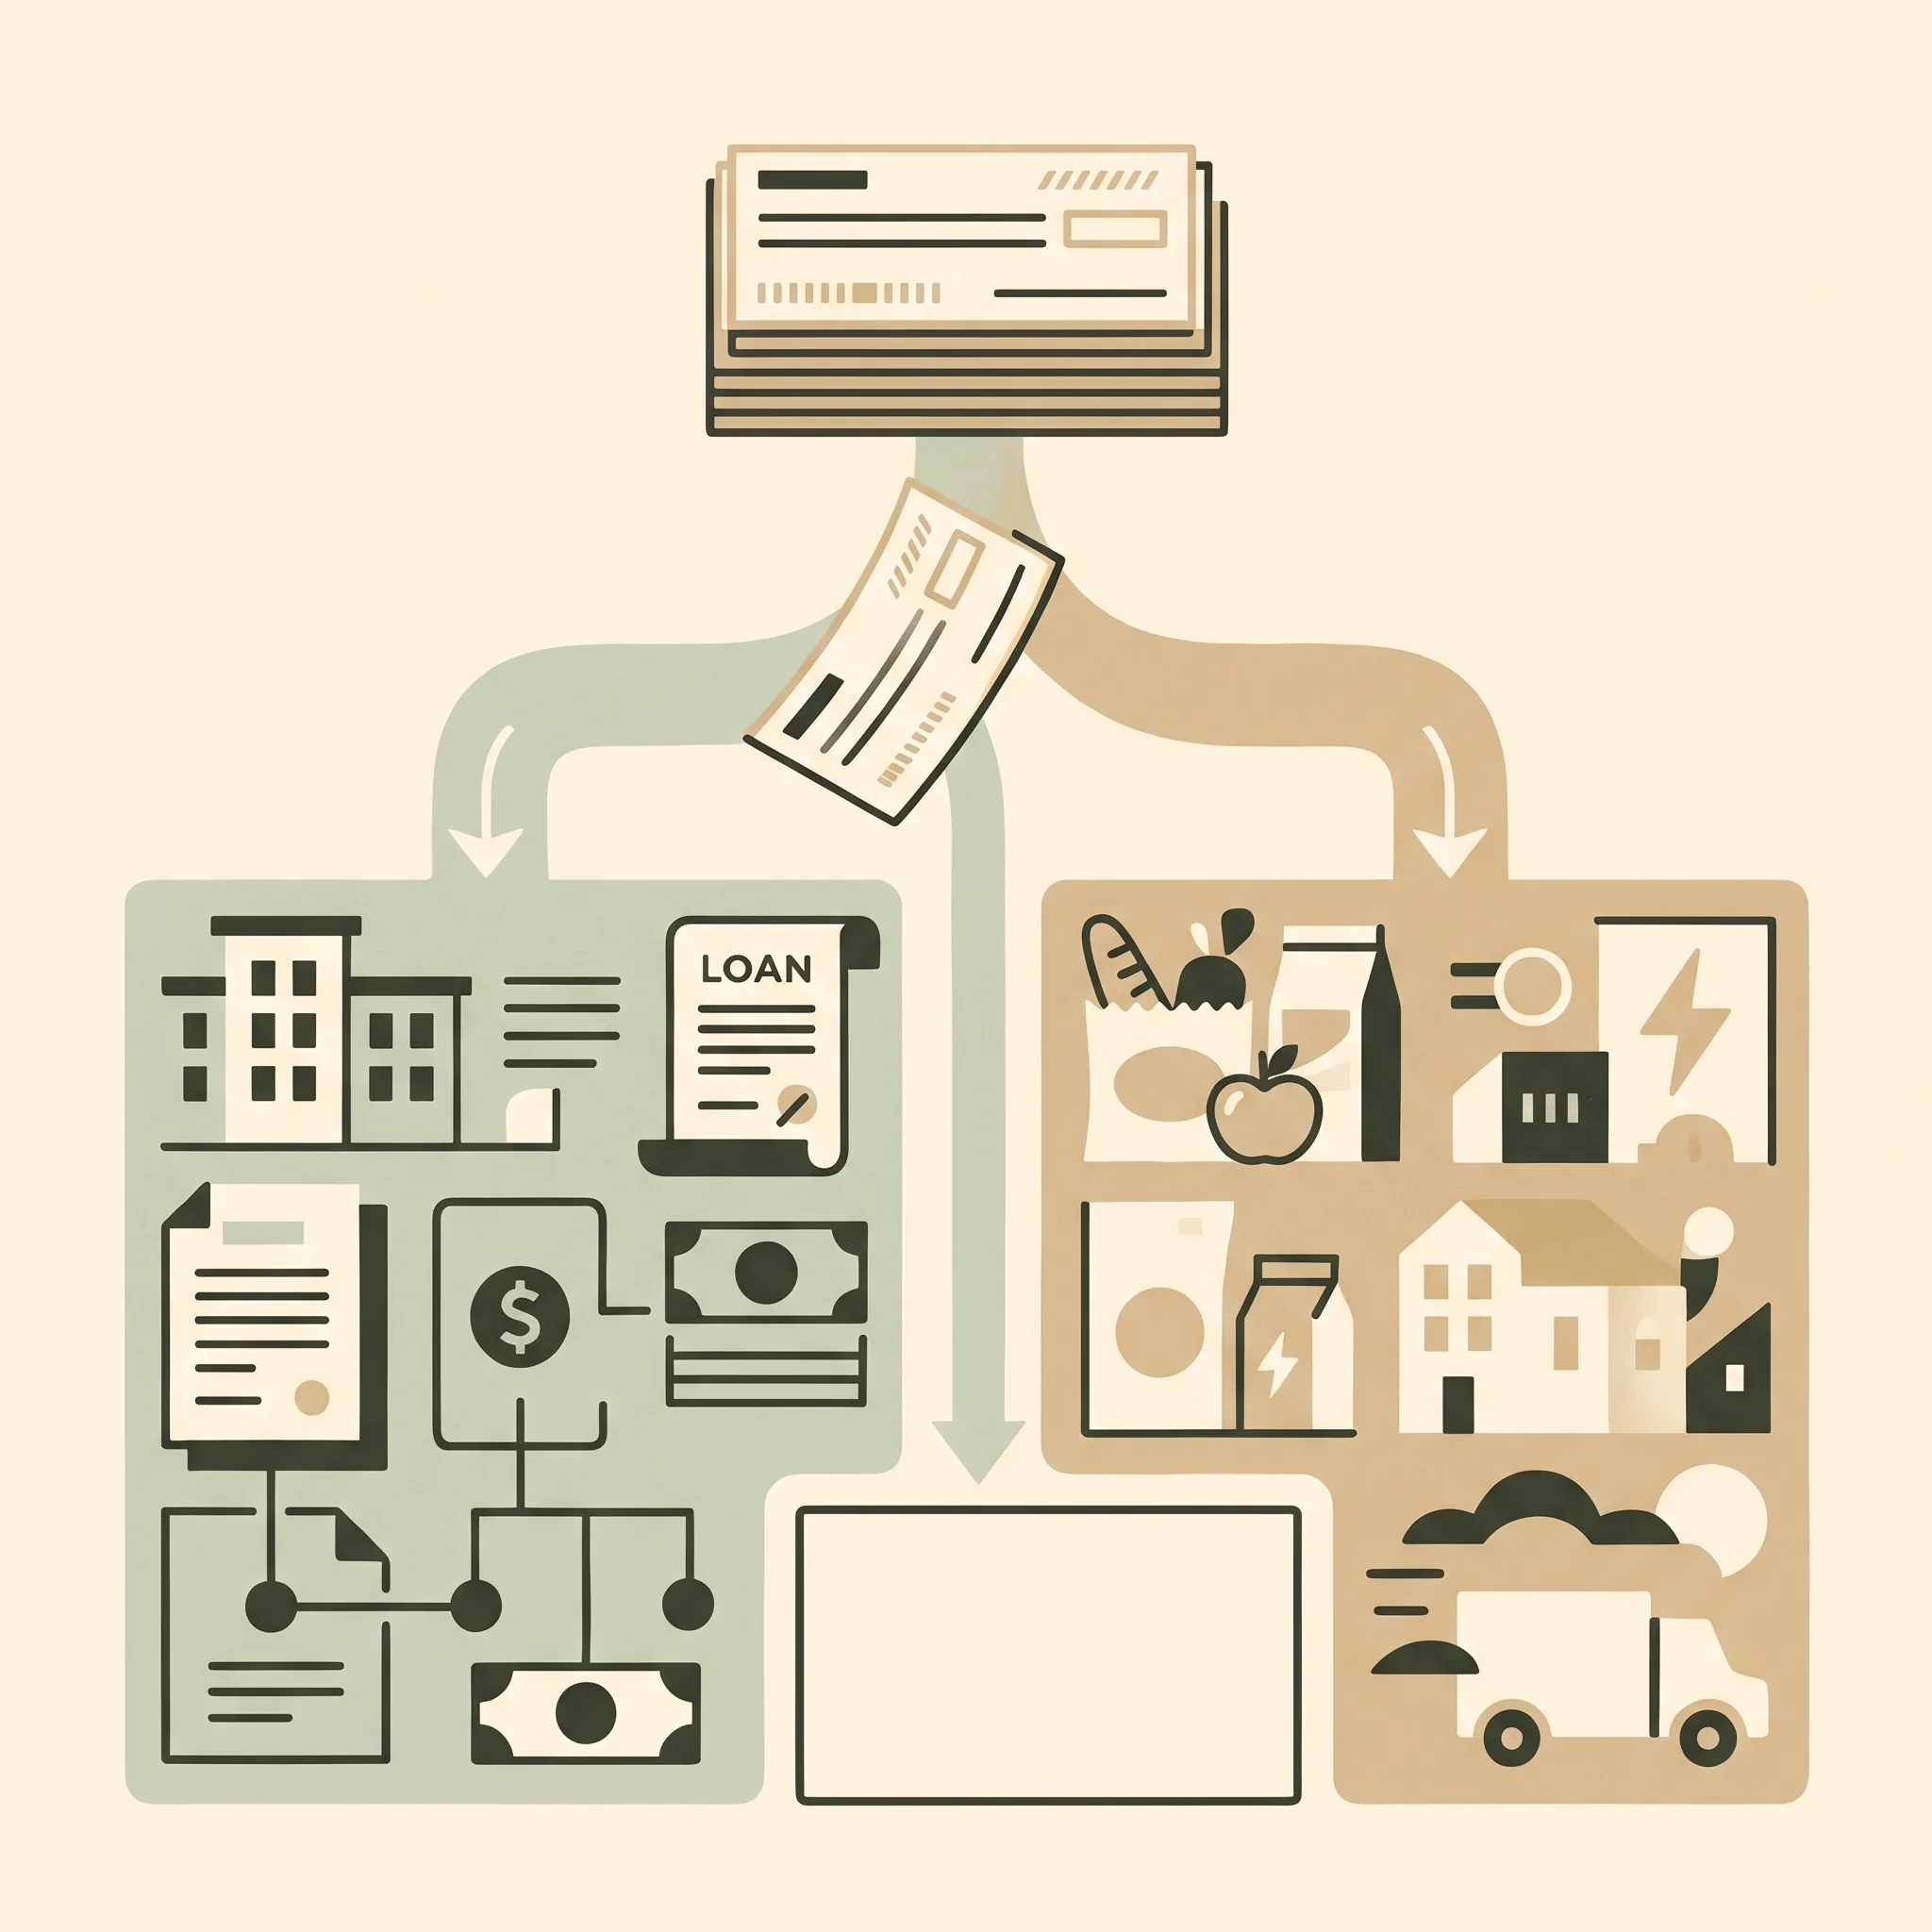
The denominator matters. DTI uses gross income before taxes and deductions. A household check should also use take-home pay, because rent, food, transport, and utilities come out of the money you receive. Keep both numbers. They describe different pressures.
Running It on Real Numbers
In this example, $1,440 in monthly debt payments on $4,800 of gross income gives a 30% DTI. The separate cash-flow check shows why that ratio alone cannot say whether the month feels manageable.
For example, assume take-home pay is $3,700. Rent, utilities, food, and transport total $2,150. Required debt payments are $1,440. The arithmetic is:
| Example line | Amount |
|---|---|
| Gross monthly income | $4,800 |
| Required debt payments | $1,440 |
| DTI: $1,440 ÷ $4,800 | 30% |
| Take-home pay | $3,700 |
| Essentials in this example | $2,150 |
| Room after essentials and debt payments | $110 |
The $110 is before irregular costs or anything left out of the example. The 30% ratio looks like one manageable number. With $110 left, a car repair or fewer work hours could upset the month. These figures belong to this example only.
Check which payment is most at risk next. List each due date beside its minimum. If a payment comes before income arrives, timing may be the immediate problem. If minimums exceed available cash, discuss the amount due with the lenders.
If you want to turn a set of balances and minimums into a payoff timeline, this debt payoff spreadsheet walkthrough shows how a payment schedule can make the order and estimated debt-free month visible.
Three signs your debt is squeezing the month
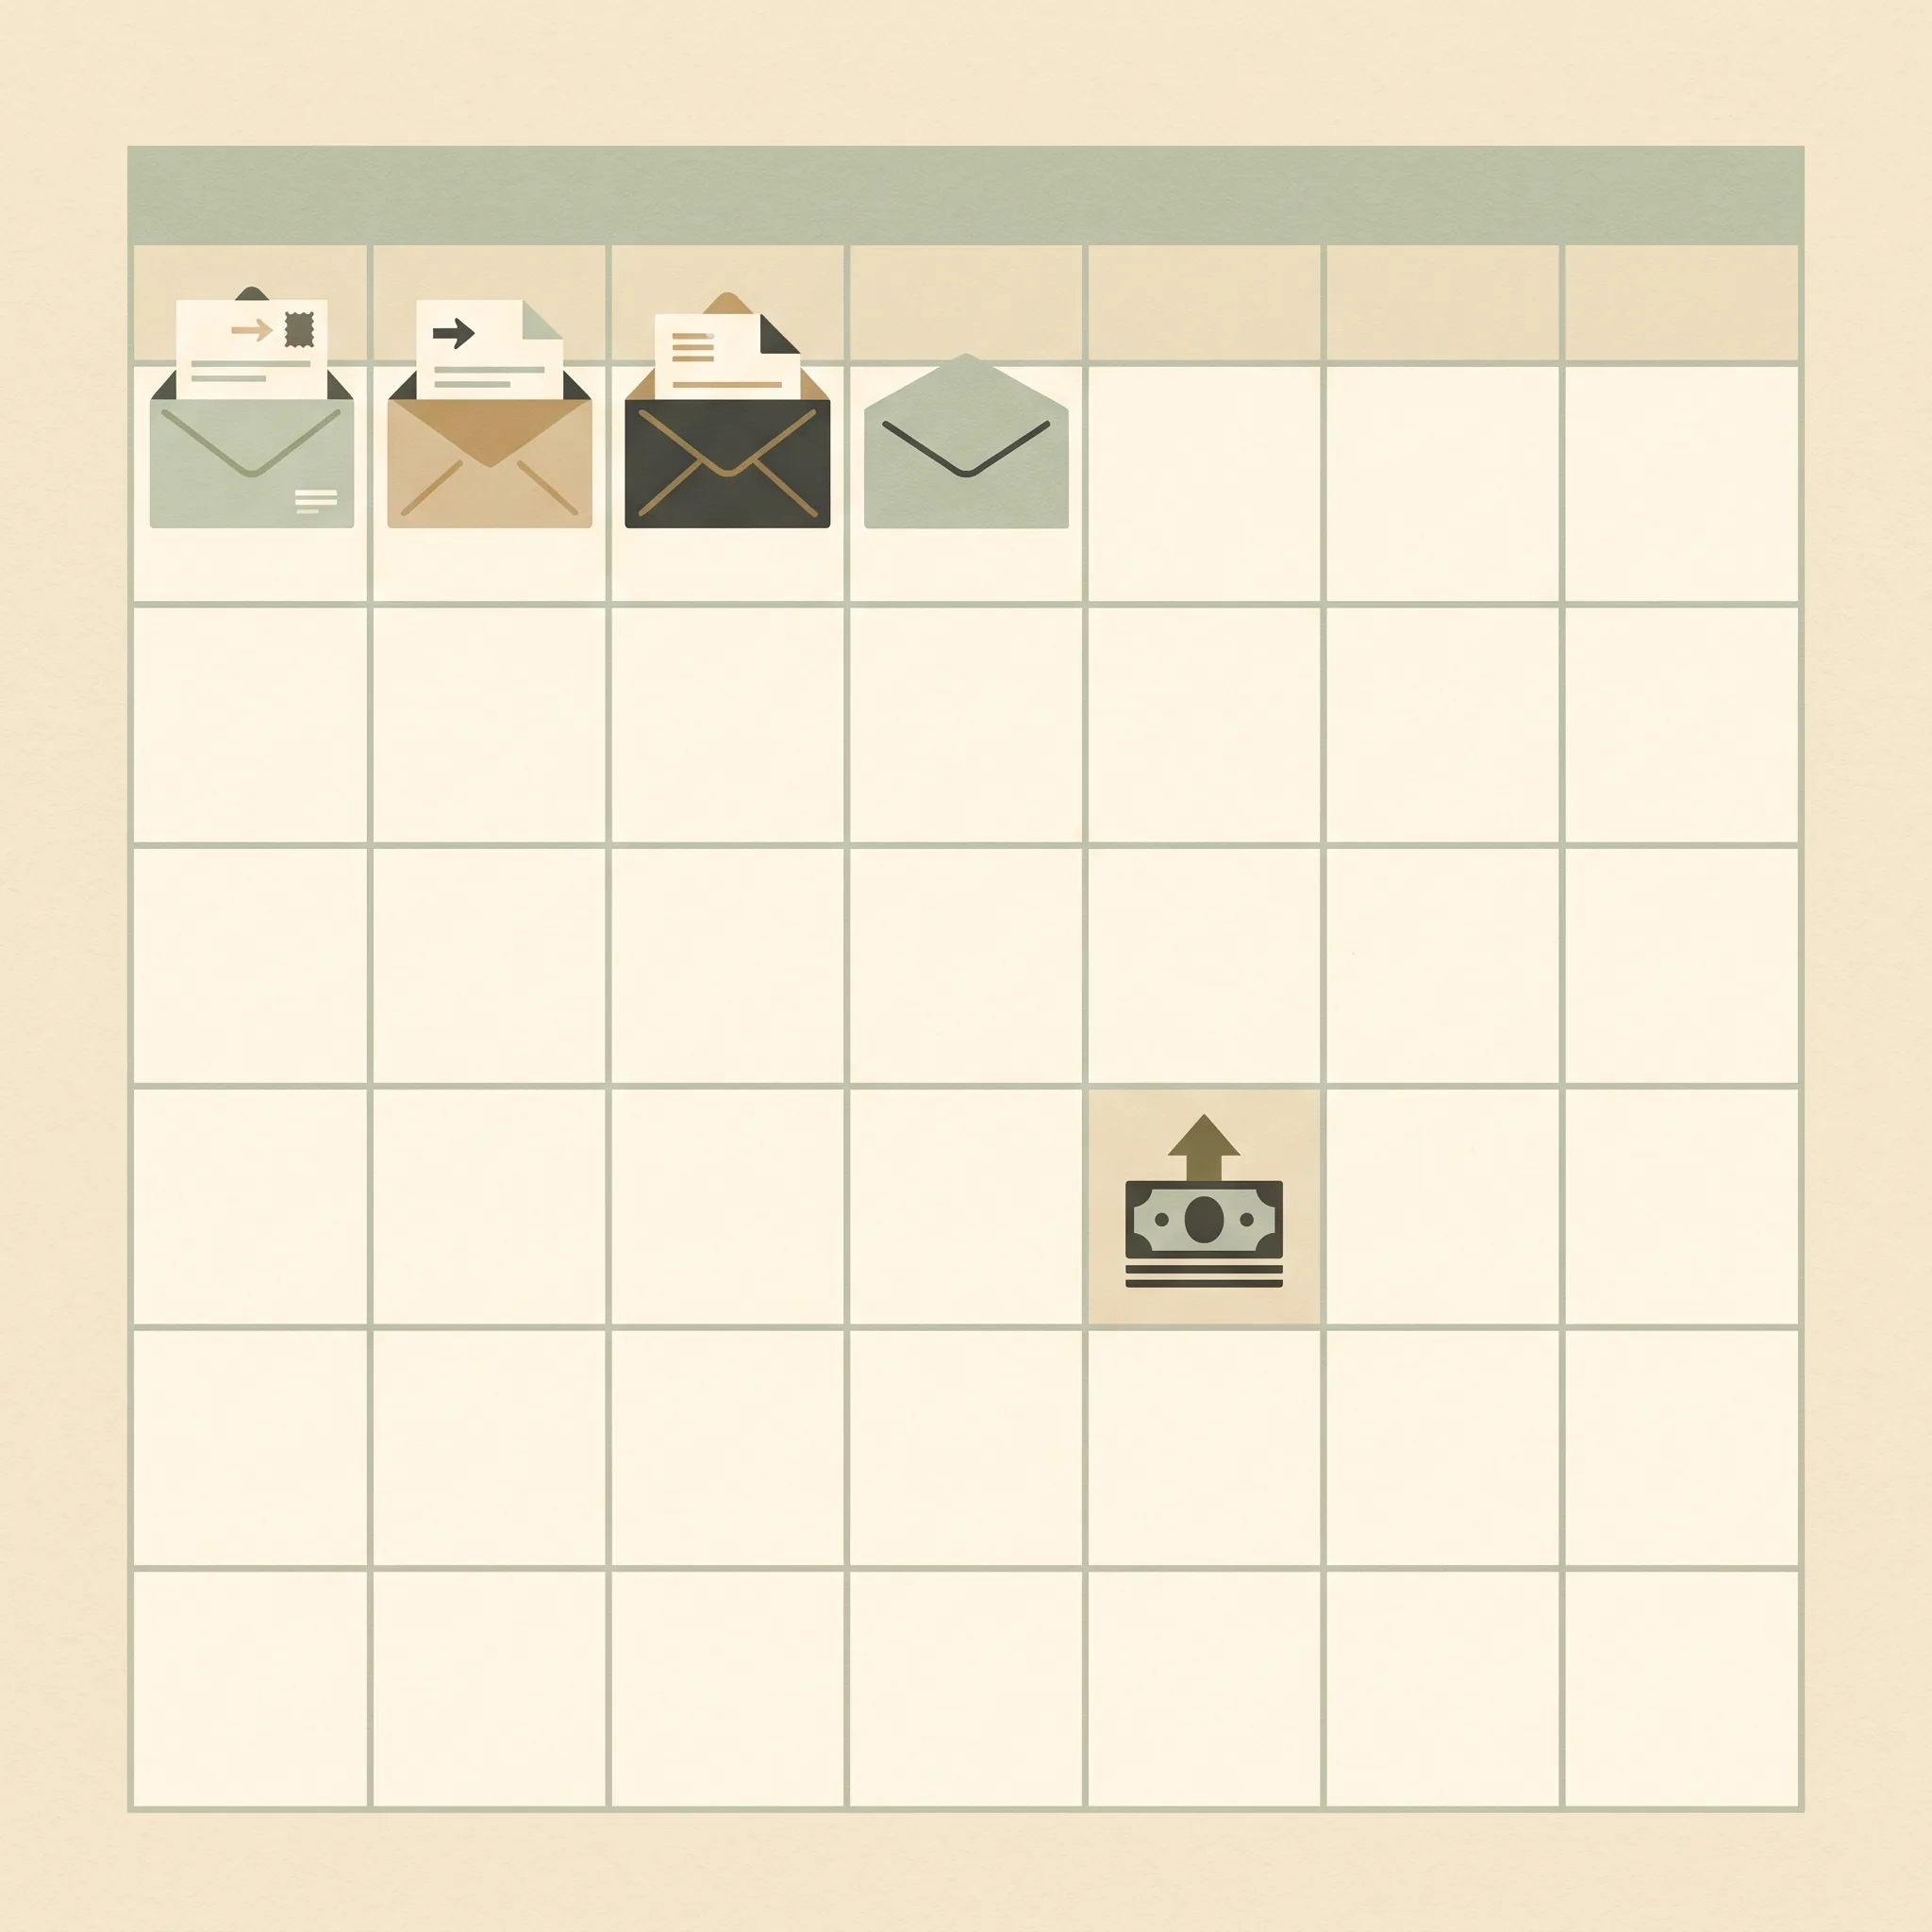
Your debt deserves attention when the required payments repeatedly crowd out essentials, create missed due dates, or push you to borrow again for ordinary expenses. These signs are about what is happening in your month, not a score from a lender.
You are short before the next payday. Compare the dates money arrives with the dates minimums are due. Record the shortfall and the payment that creates it. A calendar view can expose a timing gap that a monthly total hides.
In the sheet: write each minimum and due date beside its account.
You use new borrowing for basics. If a card or loan repeatedly covers food, utilities, or another bill, the monthly plan is not balancing. Add those new charges to the amount owed instead of treating them as a one-time exception.
In the sheet: update balances after new charges and payments post.
A payment is already late or at risk. Check the account's current due date and contact the lender before it passes if you expect a problem. Ask about available options and request the terms in writing.
In the sheet: flag the next payment that needs a call or a calendar reminder.
Why lender ratios and household pressure differ
DTI is a lender measure. It does not include every household cost, and lenders can set different limits for different products. Use a lender's threshold only for the loan decision it describes.
The Federal Reserve publishes a national measure called the household debt service ratio. It compares required debt payments with disposable personal income across households. From Q1 2005 through Q2 2026, the series ranged between 9.05% in Q1 2021 and 15.85% in Q4 2007. It was 11.11% in Q2 2026. That national figure cannot tell you whether your own debts are affordable. (Federal Reserve, released September 22, 2026)
The Fed's calculation also differs from personal DTI. Its current method estimates required payments on mortgages, consumer loans, and lines of credit. It divides the total by disposable personal income. Personal DTI uses gross income and a borrower's monthly debt payments. The measures cover different populations and use different denominators. (Federal Reserve, methodology)
What a balance total leaves out
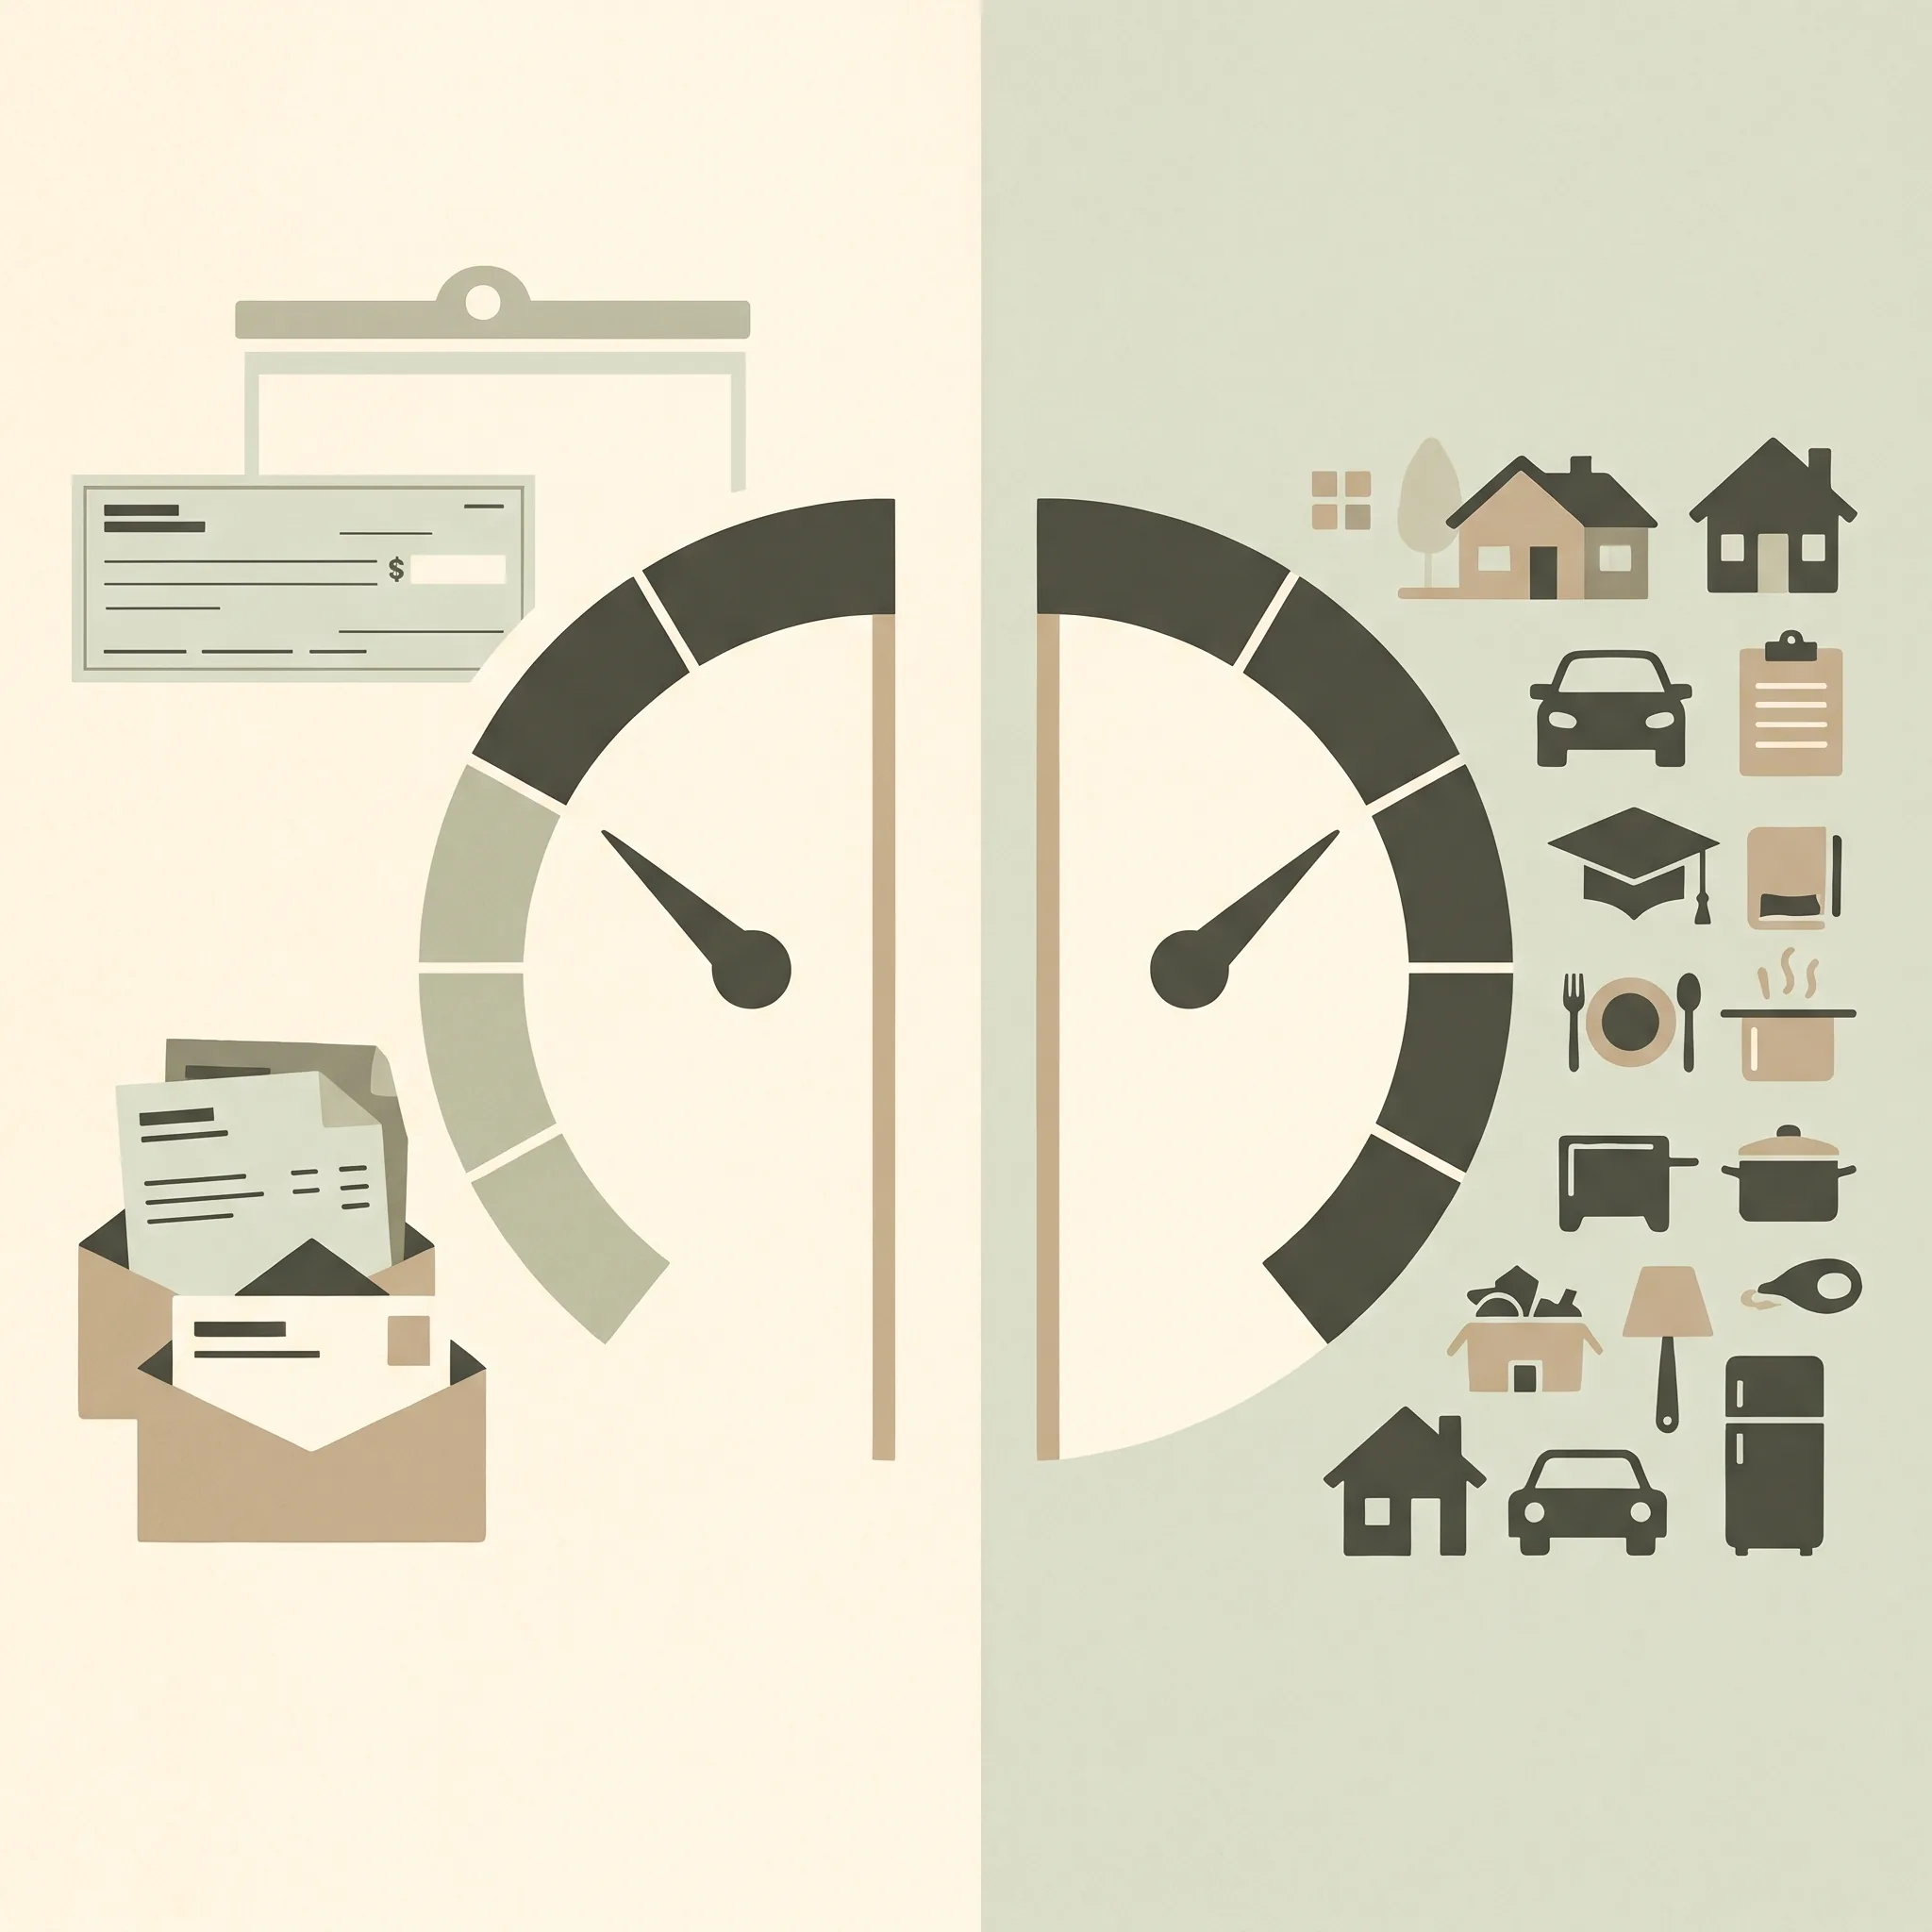
The balance total tells you how much principal remains. The required payment shows what has to leave your account this month. Interest rates and payment rules affect how quickly a balance changes. Two people with the same total can face different monthly pressure.
For instance, picture two hypothetical accounts with $5,000 owed. One has a required payment of $125; another has a required payment of $250. The balances match, but the second account takes $125 more from this month's cash. The figures are examples, not estimates of typical lender terms.
That difference matters when the calendar is tight. A total balance can feel daunting even when scheduled payments fit the month. A smaller amount can still be hard to carry if payments arrive before income or leave too little for essentials.
Interest changes the pace of repayment. Depending on the account terms, part of a payment may cover interest or fees before reducing principal. Check the statement for the amount applied to the balance. If the balance rises after payments, review new charges, fees, and interest with the lender.
For cards, the balance relative to the credit limit is another separate measure called credit utilization. It does not replace the payment-to-income ratio or the cash-flow check.
When the same ratio can feel different
Two households can have the same DTI and different amounts left after deductions and essentials. Gross income leaves out taxes and other payroll deductions, and household costs vary. A ratio can help describe a loan application while missing a cash shortage between paydays.
Return to the example: $1,440 divided by $4,800 equals 30%. If required payments were $1,200 on the same gross income, the ratio would be 25%. If they were $1,680, it would be 35%. Those are three calculations, not approved or recommended limits.
With the same $3,700 take-home pay and $2,150 in example essentials, the lower-payment version leaves $350 after minimums. The higher-payment version is short by $130 before irregular costs. Check the actual bills and account terms before drawing a conclusion. A ratio alone does not show those details.
One month can mislead when pay varies. Keep its label beside the calculation and compare it with a lower-income month you have received. Use a paycheck record rather than a forecast. If that lower month cannot cover payments and essentials, note the gap and contact lenders before due dates.
For a closer look at balances on revolving accounts, see how credit utilization is calculated across cards. If you are comparing payment priorities, the snowball and avalanche methods explain how balance size and APR can change the order.
How to check your own numbers
Use one recent month of statements and pay records. Keep required debt payments separate from optional extra payments, then run the ratio and the cash-flow check side by side.
- Add the required payments. Include the minimums or scheduled payments due each month. Do not add an extra amount you choose to pay above those requirements.
- Divide by gross monthly income. If income varies, note which month you used and avoid treating one unusually strong month as the usual amount.
- Check take-home cash. Subtract essentials and required debt payments from the money deposited after deductions. List irregular costs separately so they do not disappear from the picture.
- Mark the next pressure point. Write down the payment date, amount, and lender contact option for any account you may struggle to cover.
If you want to see how your balance total changes from month to month, a debt payoff spreadsheet keeps each account, payment and due date in one place.
How We Put This Together
General information, not financial advice. We used the CFPB's DTI definition and lender-limit note, plus the Federal Reserve's latest household debt service data and methodology, checked November 3, 2026. The monthly budget figures are a labeled arithmetic example, not a recommendation or a typical household.
Read our editorial policy for how we check sources and correct factual errors.
If a minimum payment may be missed, contact the lender before its due date and review any offer carefully. A nonprofit credit counselor can help you talk through options for your situation.
Frequently asked questions
Is 30% debt-to-income too high?
There is no single cutoff for every borrower. Lenders set different limits for different loan products. Compare required debt payments with gross income, then check whether take-home pay covers essentials and those payments.
Does a high debt balance always mean I have too much debt?
No. A balance leaves out income, interest, required payments, and what remains after essentials. A smaller balance can strain a tight month. A larger loan with a lower payment may fit comfortably.
Should I use gross income or take-home pay?
Use gross monthly income for the debt-to-income ratio lenders commonly use. For a household cash-flow check, use the money that reaches your account after deductions. The two figures answer different questions.
What should I do if I cannot make a minimum payment?
Contact the lender before the due date and ask what options are available. Review the account terms and any written offer carefully. For broader support, a nonprofit credit counselor can discuss your situation.
